Charts
FastExcelWriter – Charts (since v.5.0)
You can insert charts to generated spreadsheets (You can find usage examples below or in /demo folder)
Simple usage of Chart
// Create Excel workbook
$excel = Excel::create(['Chart Demo']);

$sheet = $excel->sheet();

$data = [
    ['',    2010,   2011,   2012],
    ['Q1',   12,   15,      21],
    ['Q2',   56,   73,      86],
    ['Q3',   52,   61,      69],
    ['Q4',   30,   32,      0],
];

foreach ($data as $row) {
    $sheet->writeRow($row);
}

// Define data series for chart
$dataSeries = [
    // key - cell with name of data series
    // value - range with data series
    'B1' => 'B2:B5',
    'C1' => 'c2:c5',
    'D1' => 'd2:d5',
];

$chartTitle = 'Bar Chart';

// Create chart
$chart = Chart::make(Chart::TYPE_COLUMN, $chartTitle, $dataSeries)
    // X axis tick values
    ->setCategoryAxisLabels('A2:A5')
    // Position of legend
    ->setLegendPosition(Legend::POSITION_TOPRIGHT)
;

//  Add the chart to the worksheet
$sheet->addChart('A7:H20', $chart);

// Save to XLSX-file
$excel->save($outFileName);
Advanced Example
When you use a simple address D8, it is always converted to the absolute address of the sheet
where the chart is inserted: Worksheet!$D$8
$sheet = $excel->getSheet('Jan');
$chart = Chart::make(Chart::TYPE_COLUMN, $chartTitle, ['A1' => 'A2:A5']);

// This code will give the same result
$chart = Chart::make(Chart::TYPE_COLUMN, $chartTitle, ['Jan!$A$1' => 'Jan!$A$2:$A$5']);
$chart = Chart::make(Chart::TYPE_COLUMN)
    ->addDataSeriesSet(['Jan!$A$1' => 'Jan!$A$2:$A$5', 'Feb!$A$1' => 'Feb!$A$2:$A$5'])
    ->addDataSeriesValues('B2:B5', 'B1')
    ->addDataSeriesValues('C2:B5', 'Demo1');
;
$options = [
    'color' => '#ff0000', // used for any chart types
    'width' => '10', // used for lines charts only
    'marker' => true, // used for lines charts only
    'segment_colors' => '#ff0000,cbcb00,0c0' // used for pie and pie3D
];

$chart = Chart::make(Chart::TYPE_LINE)
    ->addDataSeriesValues($dataSource, $labelSource, $options);
- 6 hex chars with '#' - #ffcc00
- 6 hex chars without '#' - ffcc00
- 3 hex chars with '#' - #fc0
- 3 hex chars without '#' - fc0
Multiple charts
// Make chart 1
$chart1 = Chart::make(Chart::TYPE_COLUMN, 'Column Chart', ['b1' => 'B2:B5', 'c1' => 'c2:c5', 'd1' => 'd2:d5'])
    ->setCategoryAxisLabels('A2:A5')
    ->setLegendPosition(Legend::POSITION_TOPRIGHT)
;

//  Add the chart to the worksheet
$sheet1->addChart('a9:h22', $chart1);

// Make chart 2
$chart2 = Chart::make(Chart::TYPE_PIE, 'Pie Chart', ['b6:d6'])
    ->setCategoryAxisLabels('b1:d1')
    ->setLegendPosition(Legend::POSITION_TOPRIGHT)
    ->setPlotShowPercent(true)
;

//  Add the chart to the worksheet
$sheet1->addChart('i9:m22', $chart2);
Combo charts
You can combine two types of charts on one plot - column charts and line charts
// Create combo chart
$chart = Chart::make(Chart::TYPE_COMBO, 'Combo Chart', )
    // add column data series:
    // addDataSeriesType(\<type>, \<data source>, <label source>)
    ->addDataSeriesType(Chart::TYPE_COLUMN, 'B2:B5', 'B1')
    // add another column data series
    ->addDataSeriesType(Chart::TYPE_COLUMN, 'C2:C5', 'C1')
    // add another line data series
    ->addDataSeriesType(Chart::TYPE_LINE, 'D2:D5', 'D1')
    // source of category (horizontal) axis labels
    ->setCategoryAxisLabels('A2:A5')
    // position of legend
    ->setLegendPosition(Legend::POSITION_TOPRIGHT)
;

//  Add the chart to the worksheet
$sheet1->addChart('a9:h22', $chart);
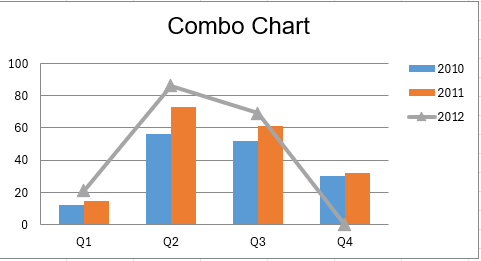
Chart types
| const name of class Chart |
chart type | |
|---|---|---|
| TYPE_BAR | bar chart | 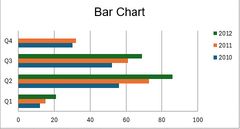 |
| TYPE_BAR_STACKED | stacked bar chart | 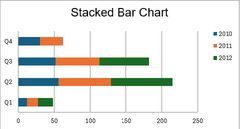 |
| TYPE_COLUMN | column chart | 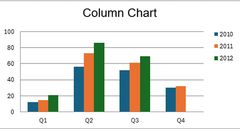 |
| TYPE_COLUMN_STACKED | stacked column chart | 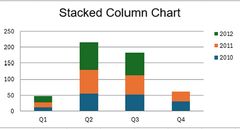 |
| TYPE_LINE | line chart | 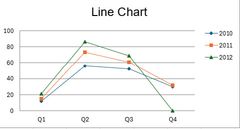 |
| TYPE_LINE_STACKED | stacked line chart | 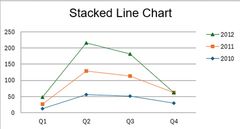 |
| TYPE_LINE_3D | line 3D chart | 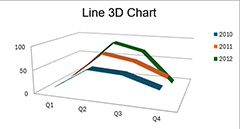 |
| TYPE_LINE_3D_STACKED | stacked line 3D chart | 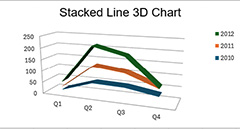 |
| TYPE_AREA | area chart | 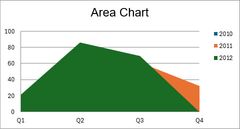 |
| TYPE_AREA_STACKED | stacked area chart | 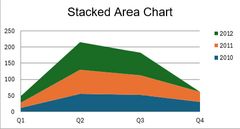 |
| TYPE_AREA_3D | area 3D chart | 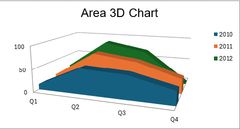 |
| TYPE_AREA_3D_STACKED | stacked area 3D chart | |
| TYPE_PIE | pie chart | 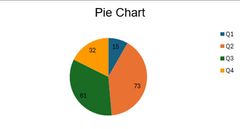 |
| TYPE_PIE_3D | pie 3D chart | 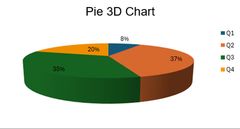 |
| TYPE_DONUT | doughnut chart | 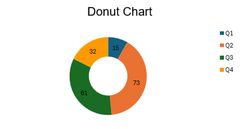 |
Useful Chart Methods
- setTitle(\
) - chart title - setChartColors(\
) - chart colors - setCategoryAxisLabels(\
) - category axis tick values - setCategoryAxisTitle(\
) - category axis title - setValueAxisTitle(\
) - value axis title - setLegendPosition(\
) - position of legend (use constants Legend::POSITION_XXX) - setPlotShowValues(true) - show values on the chart
- setPlotShowPercent(true) - show values as percents (for pie and donut)